- 1. Project Structure
- 2. mainwindow.h
- 3. mainwindow.cpp
- 4. Result
- 5. Video
Constantly I hear about QCustomPlot on working with graphs to Qt, but on the start of the made in one my application I worked without special libraries, and now in a same moment decided to get acquainted with this library. It seemed that after all it has more work to developers, but at the moment she has a very powerful functionality. I work with her with pleasure and sketched their code for pampering and studying.
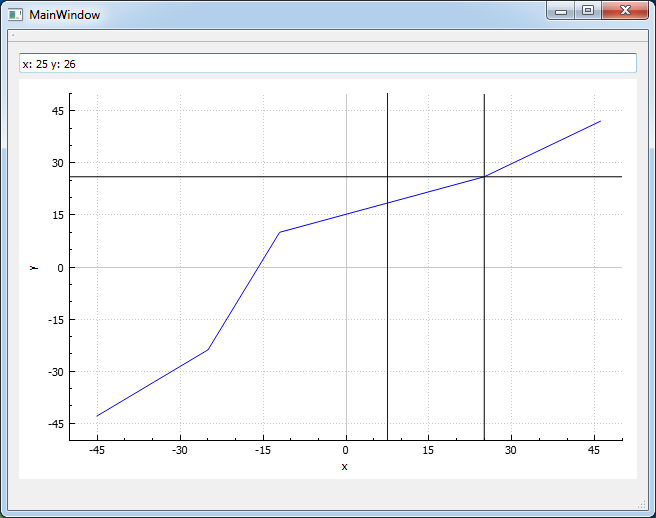
Now, Let`s learn it. The program in the example must perform the following functions:
- Draw the one graph on several points;
- Have a vertically movable line;
- For a vertical line will follow the router, which will be up to the next point on the graph of the vertical line.
Project Structure

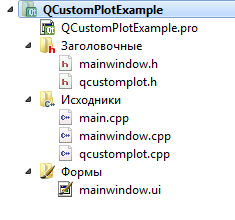
- QCustomPlotExample.pro - the profile of the project;
- mainwindow.h - header file of the main application window;
- mainwindow.cpp - file source code of the main application window;
- main.cpp - the main file of the application source code;
- qcustomplot.h - header QCustomPlot library file;
- qcustomplot.cpp - QCustomPlot source file.
Listings of the library file, they are very large and we did not climb in them, just add the files to the project and connect the header file in the MainWindow class.
mainwindow.h
The MainWindow class header files are included library QCustomPlot, as well as to declare the plot, vertical line as the object class and tracer QCPCurve QCPItemTracer.
- #ifndef MAINWINDOW_H
- #define MAINWINDOW_H
- #include <QMainWindow>
- #include <qcustomplot.h>
- #include <QDebug>
- namespace Ui {
- class MainWindow;
- }
- class MainWindow : public QMainWindow
- {
- Q_OBJECT
- public:
- explicit MainWindow(QWidget *parent = 0);
- ~MainWindow();
- private:
- Ui::MainWindow *ui;
- QCustomPlot *wGraphic;
- QCPCurve *verticalLine;
- QCPItemTracer *tracer;
- private slots:
- void slotMousePress(QMouseEvent * event);
- void slotMouseMove(QMouseEvent * event);
- };
- #endif // MAINWINDOW_H
mainwindow.cpp
QCustomPlot can give signals to mouse clicks and movement, and under normal circumstances he always causes the mouse movement signal over the other, so you need to check whether a mouse button is pressed to make a redraw the contents of the web. In that case, if the mouse button is pressed, then we will move the vertical line, and after it will skip tracer, posing in a field lineEdit your location. That is, in the graph which point it is currently installed. Note that the router does not pass along all points of the graph, but only for those that have been downloaded via QVector .
Installing QCustomPlot object in the application window is made not through the IDE QtCreator graphic designer, and in the original application code.
- #include "mainwindow.h"
- #include "ui_mainwindow.h"
- #include <QApplication>
- MainWindow::MainWindow(QWidget *parent) :
- QMainWindow(parent),
- ui(new Ui::MainWindow)
- {
- ui->setupUi(this);
- // this->setGeometry(300,100,640,480);
- wGraphic = new QCustomPlot();
- ui->gridLayout->addWidget(wGraphic,1,0,1,1);
- // Init vertical Line
- verticalLine = new QCPCurve(wGraphic->xAxis, wGraphic->yAxis);
- connect(wGraphic, &QCustomPlot::mousePress, this, &MainWindow::slotMousePress);
- connect(wGraphic, &QCustomPlot::mouseMove, this, &MainWindow::slotMouseMove);
- // creating a vector for the vertical line
- QVector<double> x(2) , y(2);
- x[0] = 0;
- y[0] = -50;
- x[1] = 0;
- y[1] = 50;
- wGraphic->addPlottable(verticalLine); // Adding a line on the canvas
- verticalLine->setName("Vertical"); // Set its name
- verticalLine->setData(x, y); // And sets the coordinates
- // creating of the graphics vector
- QVector<double> x1(5) , y1(5);
- x1[0] = -45;
- y1[0] = -43;
- x1[1] = 46;
- y1[1] = 42;
- x1[2] = -25;
- y1[2] = -24;
- x1[3] = -12;
- y1[3] = 10;
- x1[4] = 25;
- y1[4] = 26;
- wGraphic->addGraph(wGraphic->xAxis, wGraphic->yAxis);
- wGraphic->graph(0)->setData(x1,y1); // Set the coordinates of the points chart
- // Initialize the router
- tracer = new QCPItemTracer(wGraphic);
- tracer->setGraph(wGraphic->graph(0));
- wGraphic->xAxis->setLabel("x");
- wGraphic->yAxis->setLabel("y");
- wGraphic->xAxis->setRange(-50,50);
- wGraphic->yAxis->setRange(-50,50);
- wGraphic->replot();
- }
- MainWindow::~MainWindow()
- {
- delete ui;
- }
- void MainWindow::slotMousePress(QMouseEvent *event)
- {
- // Find X coordinate on the graph where the mouse being clicked
- double coordX = wGraphic->xAxis->pixelToCoord(event->pos().x());
- // Prepare the X axis coordinates on the vertical transfer line
- QVector<double> x(2), y(2);
- x[0] = coordX;
- y[0] = -50;
- x[1] = coordX;
- y[1] = 50;
- // Sets the new coordinates
- verticalLine->setData(x, y);
- // According to the X coordinate mouse clicks define the next position for the tracer
- tracer->setGraphKey(coordX);
- // Output the coordinates of the point of the graph, where the router is setted in QLineEdit
- ui->lineEdit->setText("x: " + QString::number(tracer->position->key()) +
- " y: " + QString::number(tracer->position->value()));
- wGraphic->replot(); // redraw
- }
- void MainWindow::slotMouseMove(QMouseEvent *event)
- {
- if(QApplication::mouseButtons()) slotMousePress(event);
- }
Result
As a result of the work done you will receive an application, which will appear as shown in the following figure.
Link to the project download in zip-archive: QCustomPlot Example


А почему именно QCustomPlot а не QCharts?
Потому, что на момент написания статьи QCharts был только в коммерческой платной версии.
Здравствуйте. Скачал архив, работает. Создал проект и вставил код в 2 файла, ка вы указали - не работает. В mainwindow.cpp выдает 3 ошибки:
ui->lineEdit и ui->gridLayout - это объекты, которые должны были быть созданы в графическом дизайнере. ui - это объект графического интерфейса. Их у вас просто нет, поработайте с графическим дизайнером, чтобы создать его.
Но почему вы это не описали? Не могли бы вы описать.
Использование дизайнера в Qt Creator и использование ui файлов является распространённой практикой в Qt фреймворке.
Написать отдельную статью про то, что это такое? - может быть.
Описывать в каждой статье основы? - нет. Не о том статья.
такая же ошибка с методом addPlottable. Инклуд проблему не решил.
Куда инклюд писали?
Прописал в заголовочном файле mainwindow.h
То есть вы использовали последнюю версию библиотеки с сайта разработчика QCustomPlot?
Да, вы правы.. я посмотрел документацию у разработчика библиотеки. Он выпустил новую версию. И там отсутсвует данный метод.
Там сейчас делатся через QCPGraph, через установку данных через его метод data()
Спасибо за информацию, а как же теперь пользоваться QCPCurve и другими типами? Краб то заполнить могу информацией, а как добавить её на customPlot?
Меня интересует именно параметрические кривые, я могу их строить с помощью QCPTGraph, но их отображение имеет отклонения(разрывы в функции, неточности). Я полагал QCPCurve сможет решить эту проблему, но как видите из за отсутствия метода addPlottable не могу сообразить как кривую добавить на график.
Или может скачать старую версию библиотеки? Вы не могли бы скинуть файлы старой библиотеки мне на почту?
Ну параметрические кривые могу быть вполне отображены и новой библиотекой, на оф. сайте есть пара примеров параметрических кривых.
Спасибо, разберёмся)
Here the tracer is moving by Mouse Press And Mouse Move.How to move the Tracer by using the QTimer.The tracer has to be move from origin to end point automatically/programically by using QTimer.
Полезная статья. Как всегда - то что надо.
Добавлю ещё маленькую полезность - после установки tracer (88 строка) и перед выводом значений в lineEdit (91 строка) стоит добавить updatePosition иначе будут отображаться значения из предыдущей позиции.
Доброго времени, это снова я) Имеется ли возможность подключения одного QCPItemTracer ко многим QCPGraph ?
Например у нас на одном QCustomPlot создано множество QCPGraph, делать для каждого их них по одному QCPItemTracer совсем неудобно и громоздко (фильтр для проверки к какому QCPGraph ближе оказался tracer и отключение видимости всех остальных... ну так себе), создание +1 невидимого QCPGraph содержащего в себе данные всех предыдущих - накладно (сотни тысяч точек в каждом). Отсюда и возник вопрос - как используя один QCPItemTracer перемещаться по всем QCPGraph.
(на изображении небольшой пример, tracer остался где-то далеко на 1м graph())