- 1. Building a graph
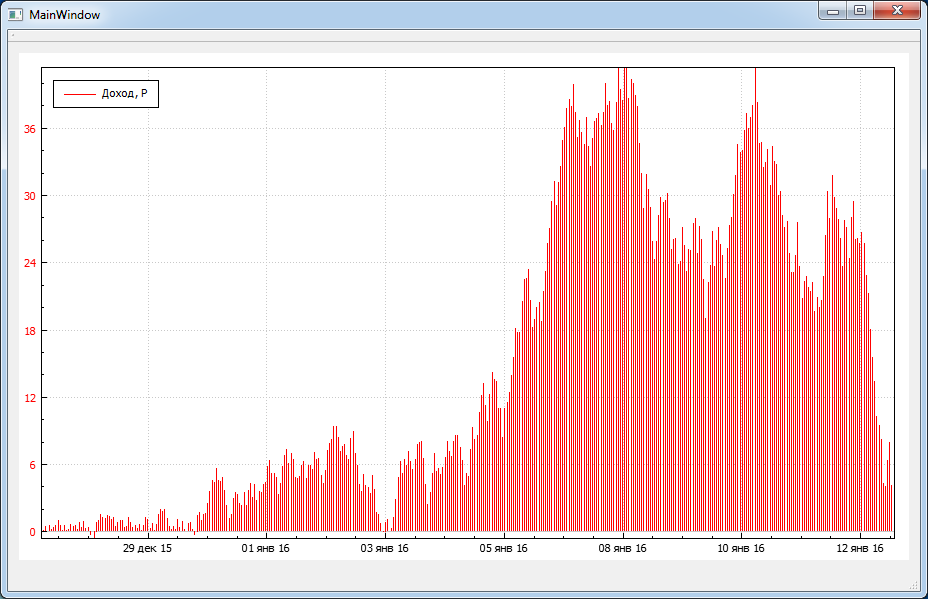
- 2. Result
- 3. Video
QCustomPlot Library has the ability to charting the scale of time, which is useful in analyzing the data, which change over time. To do this, you need to install a signature style to the time axis as QCPAxis::ltDateTime. And then set the date and time format. That is, it is possible to display on the axes or the date or time, or simultaneously do both, depending on what you specify formatting. Formatting Rules for QCustomPlot used are the same as for QDateTime , QDate , QTime , classes.
Time coordinate is transmitted in the form of a double number that starts the countdown in seconds from time 1970-01-01T00:00:00 . What to consider when plotting.
I propose to write an application that will build a pseudo-random schedule of income and rubles according to the current time coordinate. At the same time the schedule will be to communicate, that is, zoom and remove it, and move, but only on the horizontal axis. That is, the height of the graph display will not change. Also, we make it possible to change the time format in the coordinate dependence of the visible area of the chart for the time axis. That is, if the visible part of the graph in less than one day, the time-axis signature format will be as follows: hh: mm. Otherwise, the format is " dd MMM yy ".
Building a graph
We create a project and connect it to the library QCustomPlot . Modifications will be subject only mainwindow.h and mainwindow.cpp files. New files will not be added.
mainwindow.h
We declare an instance of QCustomPlot , together with a copy of the schedule. And declare the slot in which the signal is transmitted to change the display area on the time axis.
#ifndef MAINWINDOW_H
#define MAINWINDOW_H

#include <QMainWindow>
#include "qcustomplot.h"

namespace Ui {
class MainWindow;
}

class MainWindow : public QMainWindow
{
    Q_OBJECT

public:
    explicit MainWindow(QWidget *parent = 0);
    ~MainWindow();

private:
    Ui::MainWindow *ui;
    QCustomPlot *customPlot;
    QCPGraph *graphic;

private slots:
    void slotRangeChanged (const QCPRange &newRange);
};

#endif // MAINWINDOW_H
mainwindow.cpp
#include "mainwindow.h"
#include "ui_mainwindow.h"

MainWindow::MainWindow(QWidget *parent) :
    QMainWindow(parent),
    ui(new Ui::MainWindow)
{
    ui->setupUi(this);
    customPlot = new QCustomPlot();
    ui->gridLayout->addWidget(customPlot,0,0,1,1);

    customPlot->setInteraction(QCP::iRangeZoom,true);
    customPlot->setInteraction(QCP::iRangeDrag, true);
    customPlot->axisRect()->setRangeDrag(Qt::Horizontal);   // Enable only drag along the horizontal axis
    customPlot->axisRect()->setRangeZoom(Qt::Horizontal);   // Enable zoom only on the horizontal axis
    customPlot->xAxis->setTickLabelType(QCPAxis::ltDateTime);   // Labl coordinates along the X axis as the Date and Time
    customPlot->xAxis->setDateTimeFormat("hh:mm");  // Set the date and time format

    // Customizable fonts on the axes
    customPlot->xAxis->setTickLabelFont(QFont(QFont().family(), 8));
    customPlot->yAxis->setTickLabelFont(QFont(QFont().family(), 8));

    // Automatic scaling ticks on the X-axis
    customPlot->xAxis->setAutoTickStep(true);

    /* We are making visible the X-axis and Y on the top and right edges of the graph,
     * but disable them tick and labels coordinates
     * */
    customPlot->xAxis2->setVisible(true);
    customPlot->yAxis2->setVisible(true);
    customPlot->xAxis2->setTicks(false);
    customPlot->yAxis2->setTicks(false);
    customPlot->xAxis2->setTickLabels(false);
    customPlot->yAxis2->setTickLabels(false);

    customPlot->yAxis->setTickLabelColor(QColor(Qt::red));
    customPlot->legend->setVisible(true);   // Enable Legend
    // Set the legend in the upper left corner of the chart
    customPlot->axisRect()->insetLayout()->setInsetAlignment(0, Qt::AlignLeft|Qt::AlignTop);

    // Initialize the chart and bind it to the axes
    graphic = new QCPGraph(customPlot->xAxis, customPlot->yAxis);
    customPlot->addPlottable(graphic);
    graphic->setName("Доход, Р");
    graphic->setPen(QPen(QColor(Qt::red)));
    graphic->setAntialiased(false);
    graphic->setLineStyle(QCPGraph::lsImpulse); // Charts in a pulse ticks view

    connect(customPlot->xAxis, SIGNAL(rangeChanged(QCPRange)),
            this, SLOT(slotRangeChanged(QCPRange)));

    // We will build schedule with today's day and the current second in a future
    double now = QDateTime::currentDateTime().toTime_t();
    // We declare a vector of time and income
    QVector <double> time(400), income(400);

    srand(15); // Initialize the random number generator

    // ЗFill in the values of the graph
    for (int i=0; i<400; ++i)
      {
        time[i] = now + 3600*i;
        income[i] = qFabs(income[i-1]) + (i/50.0+1)*(rand()/(double)RAND_MAX-0.5);
      }

    graphic->setData(time, income);
    customPlot->rescaleAxes();
    customPlot->replot();
}

MainWindow::~MainWindow()
{
    delete ui;
}

void MainWindow::slotRangeChanged(const QCPRange &newRange)
{
    /* If a scope chart is less than one day,
     * then display the hours and minutes in the Axis X,
     * otherwise display the date "Month Day Year"
     * */
    customPlot->xAxis->setDateTimeFormat((newRange.size() <= 86400)? "hh:mm" : "dd MMM yy");
}
Result
As a result, you should get a graph similar to that shown in the following figure. Note that when you scroll the mouse wheel and moving the mouse the chart, graph itself will only be changed on the Axes X, as was intended in this example.

Попробовал собрать этот проект, но у меня ошибка ASSERT failure in QVector
::operator[]: "index out of range", file C:\Qt\Qt5.5.1\5.5\mingw492_32\include/QtCore/qvector.h, line 401
Как правильно вытащить данные из БД, если есть два поля с int и timestamp и вставить в graphic->setData(time, income); // Устанавливаем данные ?
В Дебаг режиме собирали? Кажется он в дебаге выкидывает ассерт из-за вот этой строки:
Попробуйте переписать немного иначе:
for (int i=1; i<400; ++i) { time[i-1] = now + 3600*i; income[i-1] = qFabs(income[i-1]) + (i/50.0+1)*(rand()/(double)RAND_MAX-0.5); }Вытаскивать нужно обычным QSqlQuery
QSqlQuery query;
query.exec("SELECT column1, cilumn2 FROM table;");
Получите список записей и методами first(), next(), previous(), last() уже пройтись по этому списку, устанавливая данный в график.
Спасибо. Подскажите еще пожалуйста. У меня есть таблица с доходами.
Как мне вывести сумму по дням в график?total_cash - это сумма за определённую дату, так?
Тогда запрос должен выглядеть примерно так:
Этот запрос используете с QSqlQuery и в цикле while добавляете данные в график. что-то вроде такого должно получиться:
QSqlQuery query; query.exec("SELECT SUM(total_cash) FROM cash_table WHERE date_cash BETWEEN "2017-04-01" AND "2017-04-20" GROUP BY date_cash;)"); while (query.next()) { double total_for_day = query.value(0).toDouble(); // Todo Something }При построении графика используются два параметра, время и доход. Как сопоставить дату с доходом за день?
Ну а подумать? ))
У меня тип данных в поле data_time стоял timestamp, поставил тип data и все ок. Спасибо.
Проблема с value("date_cash").toDate(); не могу передать в graphic->setData().
Прочитал. Вроде со все разобрался. Спасибо.
не могли бы вы выложить архив с рабочей версией скрипта?
После работы поищу, должен где-то быть на винте.
Добавил архив с проектом
При компиляции выдает ошибку https://cloud.mail.ru/public/FUxM/b4NFJCb9w
Мне эта ошибка ни о чём не говорит. Вообще ошибка пишет про RunTime, а ен при компиляцию. При запуске была ошибка.
Там для получения рандомных значений использует выход в неиницализированную область памяти, может из-за этот. Запустите в Release сборке.
В режиме выпуск работает
Хорошо. Там в дебаг режиме просто отслеживаются выходы за пределы массива, за счёт чего получается рандомное первоначальное значение. Для примера этого достаточно.
Скажите пожалуйста, как сделать так, что бы при перетаскивании графика, график достраивался? Пока Строиться только то, что попало в окно.
Я давно уже не работал с QCustomPlot, может создадите тему на форуме и приложите свой архив с проектом ? Надо смотреть по факту, что вы сделали.
Скажите пожалуйста, что такое gridLayout ? В аналогичном проекте выдает ошибку Ui::MainWindow' has no member named 'gridLayout'
Это объект компоновщика QGridLayout. Данная ошибка говорит о том, что данный объект не был добавлен через графический дизайнер в окно MainWindow
Здравствуйте, у меня есть БД. В нее записываются данные пришедшие с COM-порта и время, когда эти самые данные пришли (QDataTime::currentMSecsSinceEpoch()), пихаю данные DataTime в вектор, но вместо нормальной даты и времени у меня на графике показывается не тот месяц, день и даже год (50 380-год вместо 2018-го). Причем если я меняю QDataTime::currentMSecsSinceEpoch() на currentDateTime().toTime_t() все отображается нормально, но мне нужно время с миллисекундами.
Ну так здесь же указывается установка формата в статье
customPlot->xAxis->setDateTimeFormat("hh:mm:ss.zzz");Куски кода:
Дальше делаем запрос на построение таблицы. Для построения графика достаем из таблицы необходимые данные
for(int i = 0; i < countRow; i++) { date = ui->tableViewDiagrm->model()->data(//Получаем значения ячеек столбца дата/время ui->tableViewDiagrm->model()->index(i, 2)).value<qulonglong>(); mess = ui->tableViewDiagrm->model()->data(//Получаем значения ячеек столбца данных ui->tableViewDiagrm->model()->index(i, 3)).value<QString>(); //Получение десятичных значений шестнадцатиричной строки mesLong = mess.toULongLong(&ok, 16);//Переводим строку в цифры vecDateTime.push_back(date); //Соваем данные в вектор vecMessage.push_back(mesLong);//Соваем данные в вектор } graphic->setData(vecDateTime, vecMessage);//Устанавливаем данныеcustomPlot->xAxis->setTickLabelType(QCPAxis::ltDateTime);//Подпись х как дата/время customPlot->xAxis->setDateTimeFormat("hh:mm:ss.ms\n dd MM yyyy");Я думаю, что там несколько иной формат объявления милисекуд. Поробуйте так
Попробовал, но результат тот же. Спасибо за Ваши ответы и за оперативное реагирование. У Вас очень хороший сайт и канал на Utube. Если у меня получится решить проблему, я отпишусь в чем было дело.
Хорошо. Спасибо за отзыв.
Но могу дать совет посмотреть в эту часть документации на второй QCustomPlot , там есть информация по установке шаблона отображения времени.
Еще вопрос. На сайте есть такая строчка
Проблема решена путём добавления в код следующей строки:
for(int i = 0; i < countRow; i++) { date = ui->tableViewDiagrm->model()->data(//Получаем значения ячеек столбца дата/время ui->tableViewDiagrm->model()->index(i, 2)).value<qulonglong>(); date /= 1000; mess = ui->tableViewDiagrm->model()->data(//Получаем значения ячеек столбца данных ui->tableViewDiagrm->model()->index(i, 3)).value<QString>(); //Получение десятичных значений шестнадцатиричной строки //mess = QString::number(mess.toULongLong(&ok, 16), 10); mesLong = mess.toULongLong(&ok, 16);//Переводим строку в цифры vecDateTime.push_back(date); //Соваем данные в вектор vecMessage.push_back(mesLong);//Соваем данные в вектор }Ага... ясно... хотя если честно не фига не ясно )) У вас видимо своя какая-то хитрая логика была по отображению миллисекунд.
Впрочем главное, что Вы разобрались ))
Думаю, что по какой-то причине полученное число миллисекунд QCustomPlot воспринимал как секунды
Здравствайте! Подскажите, пожалуйста:
customPlot->xAxis2->setTickLabels(true); //Здесь включается отображение данных на оси xAxis2.
а можно как-то продублировать информацию customPlot->xAxis на ось customPlot->xAxis2.
Хотелось бы вверху отображать только даты. А на нижней оси только часы:мин:сек.
Добрый день.
Ну точно также добавляете ту же самую информацию на ось xAxis2, только добавляете другое форматирование
если я правильно понял ваш вопрос, конечно
Только по осям xAxis2, уAxis2 значения начинаются с 0. Почему-то xAxis2 и xAxis не синхронизированы по данным. Ну и QCustomPlot последний.