- 1. Project structure
- 2. widget.h
- 3. widget.cpp
We will analyze the creation of graphs when it is necessary to add a large number of graphs, which are created dynamically. A similar lesson was already in the article on dynamically creating widgets, only there were added QPushButton buttons. Here the same variant of work is applied. Memory is allocated in the heap, the widget is adjusted with a graph, and the widget adds to QScrollArea or QLayout to display the graph itself in the application window.
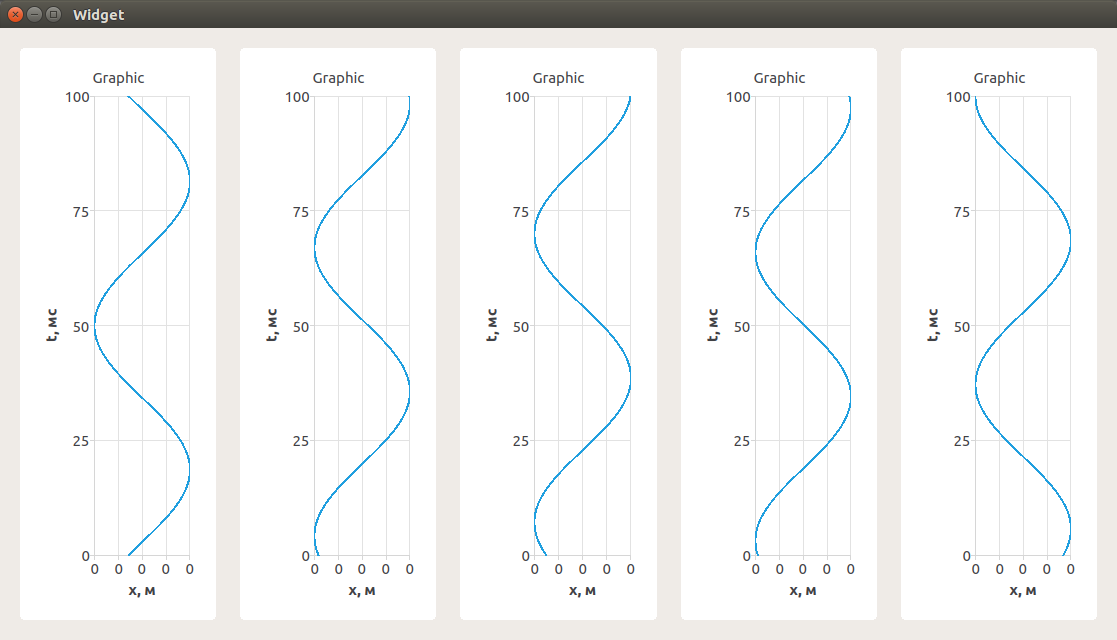
The application will look like this:

In this example, 5 graphs will be added to the horizontal Layout ( QHBoxLayout ). Also in the example, a tooltip that contains some information will be added. For example, the number of the graph and the number of counts.
Project structure
- Graphs.pro - project profile;
- widget.h - the header file for the application window;
- widget.cpp - the source file for the application window;
- widget.ui - the form of the application window;
- main.cpp - file with the main function.
main.cpp is created by default and does not change in the project. In the widget.ui file, you only need to create the QHBoxLayout placement. You can do this through the graphic designer Qt.
In the project profile, you need to connect the charts module (it must be pre-installed, in the form of precompiled libraries QtCharts is available from version Qt5.7).
- QT += charts
The widget.h header file does not make any additional changes. All the code will be contained in the file widget.cpp .
widget.h
- #ifndef WIDGET_H
- #define WIDGET_H
- #include <QWidget>
- namespace Ui {
- class Widget;
- }
- class Widget : public QWidget
- {
- Q_OBJECT
- public:
- explicit Widget(QWidget *parent = 0);
- ~Widget();
- private:
- Ui::Widget *ui;
- };
- #endif // WIDGET_H
widget.cpp
- #include "widget.h"
- #include "ui_widget.h"
- #include <QLogValueAxis>
- #include <QLineSeries>
- #include <QValueAxis>
- #include <QChart>
- #include <QChartView>
- #include <math.h>
- static int randomBetween(int low, int high, int seed)
- {
- qsrand(seed); // Set the base number for counting a random host in qrand
- return (qrand() % ((high + 1) - low) + low);
- }
- using namespace QtCharts;
- Widget::Widget(QWidget *parent) :
- QWidget(parent),
- ui(new Ui::Widget)
- {
- ui->setupUi(this);
- // Initializing number for setting the base of the randomization in qrand
- int seed = 0;
- for (int i = 0; i < 5; ++i)
- {
- // Create a graph view
- QChartView *chartView = new QChartView(this);
- // Adding it to the horizontal Layout
- ui->horizontalLayout->addWidget(chartView);
- // Create a random sinusoid
- seed = randomBetween(0, 100, seed);
- QLineSeries *series = new QLineSeries();
- int k = 0;
- while (k <= 100)
- {
- *series << QPointF(sin((seed+ k)*0.1), k);
- ++k;
- }
- // Create a graph and add a sinusoid to it
- QChart *chart = new QChart();
- chart->addSeries(series);
- chart->legend()->hide();
- chart->setTitle("Graphic");
- // Add a tooltip for the chart
- chart->setToolTip(QString("Graph №%1\n"
- "Number of counts %2").arg(i + 1).arg(k));
- // Adjusting the Axes of the Graph
- QValueAxis *axisX = new QValueAxis();
- axisX->setTitleText("x, м");
- axisX->setLabelFormat("%i");
- axisX->setTickCount(1);
- chart->addAxis(axisX, Qt::AlignBottom);
- series->attachAxis(axisX);
- QValueAxis *axisY = new QValueAxis();
- axisY->setTitleText("t, мс");
- axisY->setLabelFormat("%g");
- axisY->setTickCount(5);
- chart->addAxis(axisY, Qt::AlignLeft);
- series->attachAxis(axisY);
- // We set the graph in the view
- chartView->setChart(chart);
- }
- }
- Widget::~Widget()
- {
- delete ui;
- }

Сделайте, пожалуйста пример, где обновление уже существующего графика
Здравствуйте! Можно ли расширить данный пример создания графиков печатью их на принтере. Другими словами, как распечатать эти 5 графиков на принтере, чтобы изображение на листе бумаги было таким же, как на главном окне программы?